Geographical Performance

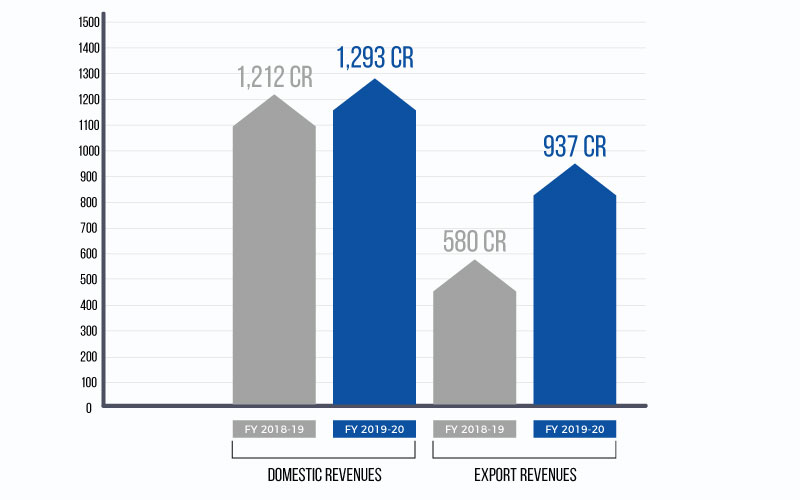
Domestic Revenues for FY 2019-20 stood at ₹ 1,293 Crores, as compared to ₹ 1,212 Crores in FY 2018-19. Export Revenues came in at ₹ 937 Crores, higher by 61% as compared to ₹ 580 Crores in the previous year. Export of DASDA and OBA played a good role. This performance has been partially caused by supernormal realisation in DASDA owing to China's temporary disruption and hence may be seen in light of this.

Domestic Revenues grew by 7% during the year led by positive demand in key end-user industries maintaining its position as a supplier of choice with cost leadership. Efficiencies in production as well as better product mix resulted in robust volume growth with better realisations for select products.
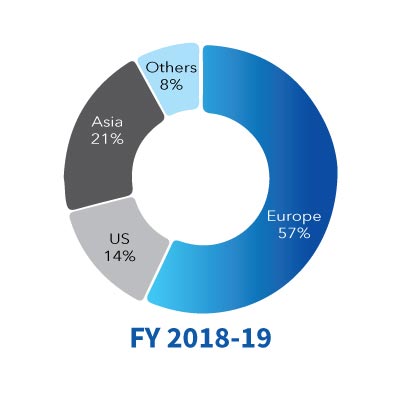
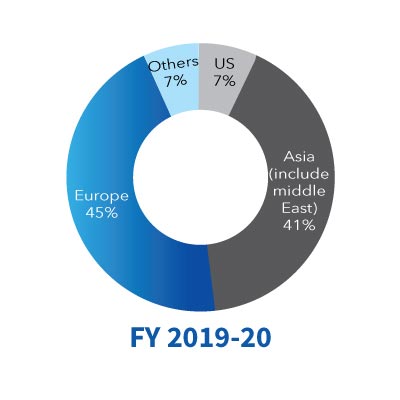
Your Company's Exports represented a growth of 61% in FY 2019-20. This was a result of focus on deepening the customer engagements in strategic geographical regions and overall shift in the global supply chain. This momentum was further supported by your Company's efforts of running plants at optimum capacities with streamlined processes and also by emphasis on export of DASDA and OBA. During the year, Europe contributed 45%, as compared to 57% in the previous Financial Year. Asia also showed an improvement contributing 41%, while the US contributed 7%. On a Standalone basis, mix of Domestic Sale versus Exports has been 58:42.


For DPL the Revenues for FY 2019-20 stood at ₹ 2,010 Crores. Domestic and Exports Revenue mix stood at 93:07.
On a Consolidated basis, the Domestic Revenues for FY 2019-20 stood at ₹ 3,158 Crores while Export Revenues came in at ₹ 1,072 Crores. Domestic and Exports Revenue mix was at 75:25.
