Financial Highlights
Ten-Year Summary
|
Consolidated
|
IND AS | Indian GAAP | ||||||||||||
|---|---|---|---|---|---|---|---|---|---|---|---|---|---|---|
| Sr.No. | Particulars | UOM* | Standalone | |||||||||||
| 2019-20 | 2018-19 | 2019-20 | 2018-19 | 2017-18 | 2016-17 | 2015-16 | 2014-15 | 2013-14 | 2012-13 | 2011-12 | 2010-11 | |||
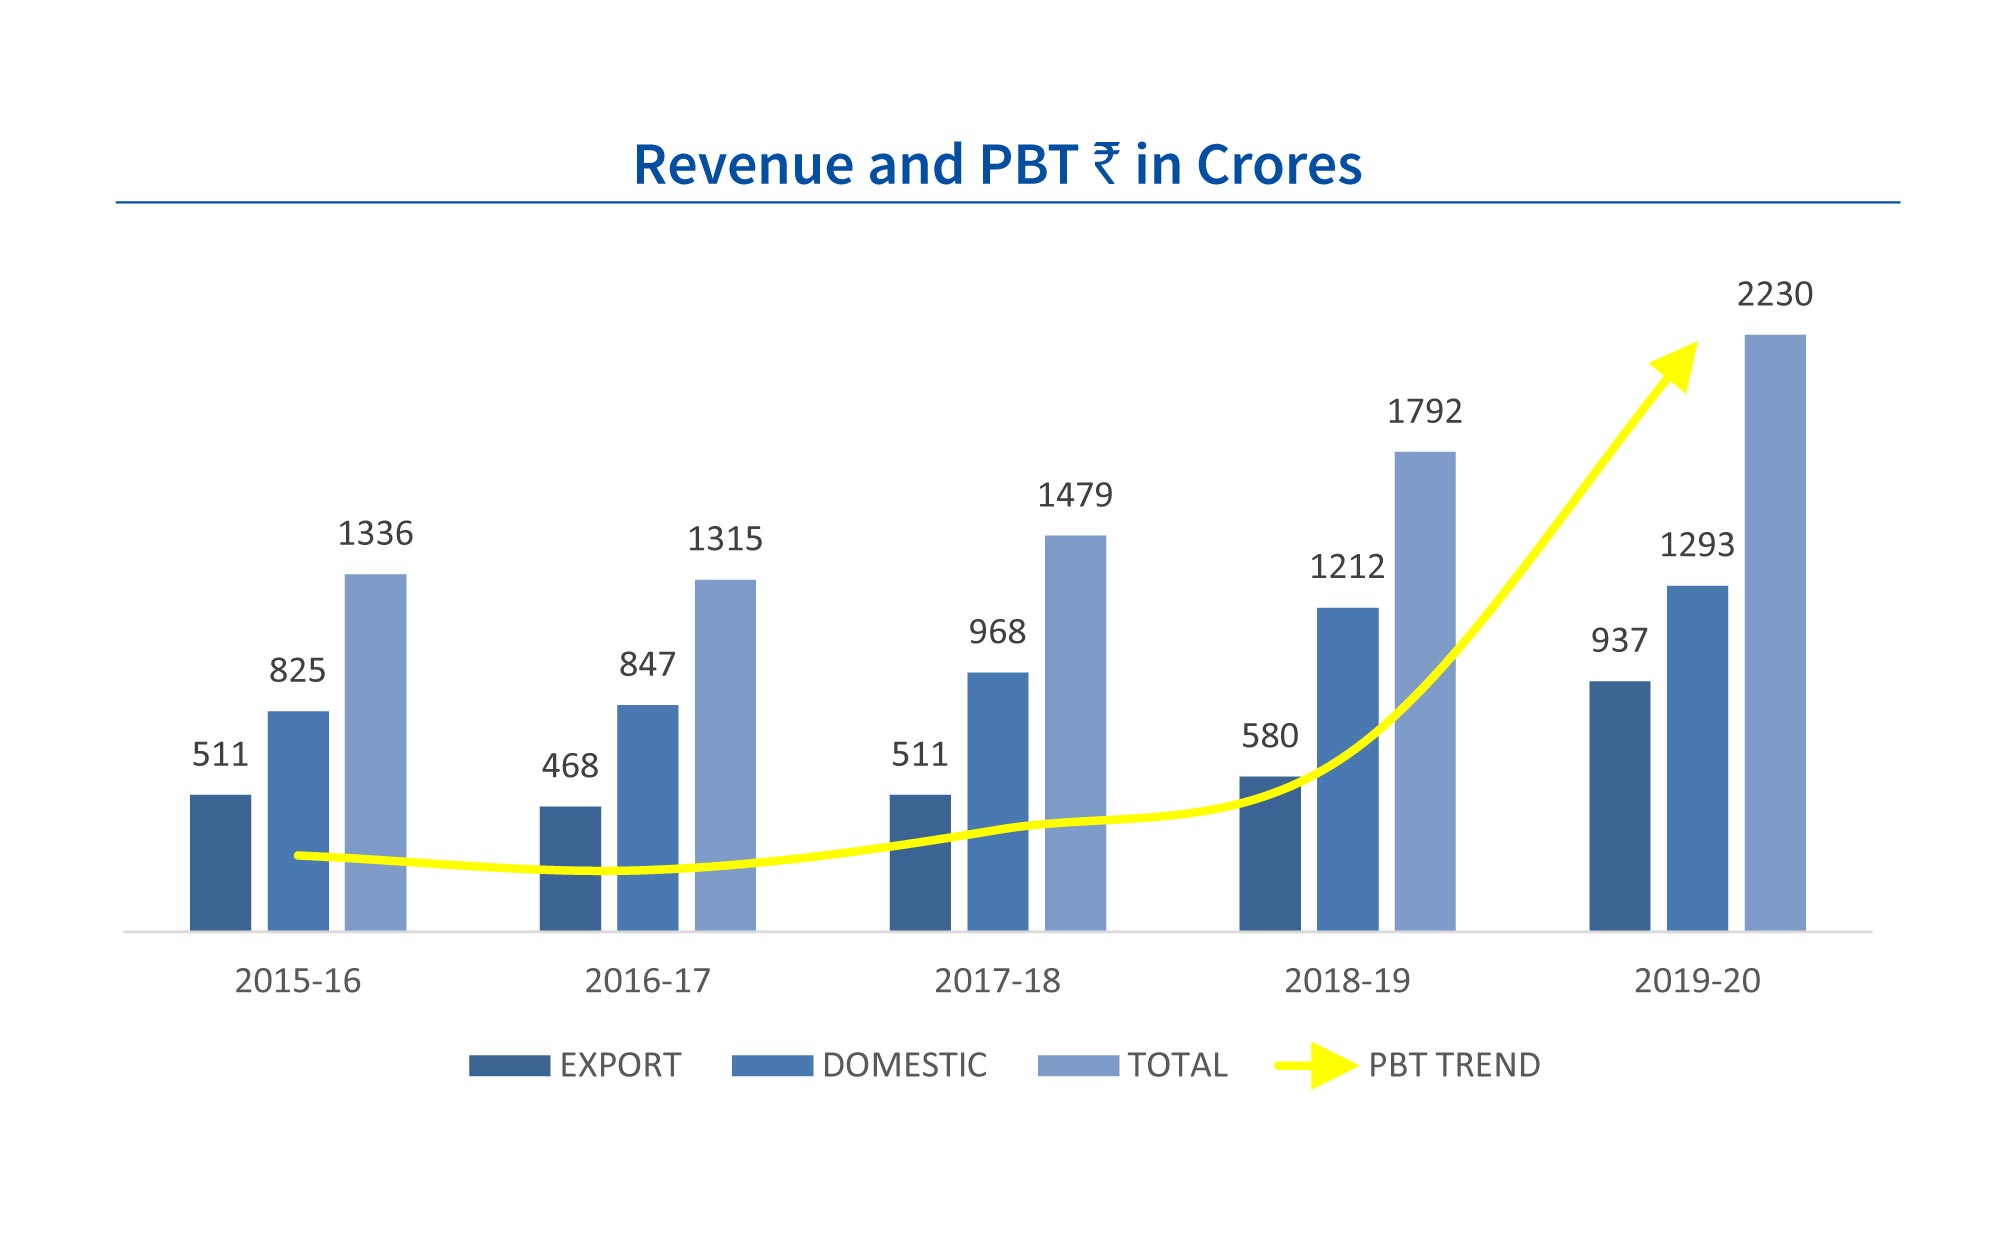
| 1 | Total Income | ₹ in Cr | 4265 | 2715 | 2237 | 1795 | 1491 | 1324 | 1337 | 1329 | 1271 | 1030 | 793 | 677 |
| YoY Growth | % | 57.08 | 60.80 | 24.67 | 20.38 | 12.56 | (0.96) | 0.61 | 4.55 | 23.42 | 29.94 | 17.02 | 23.97 | |
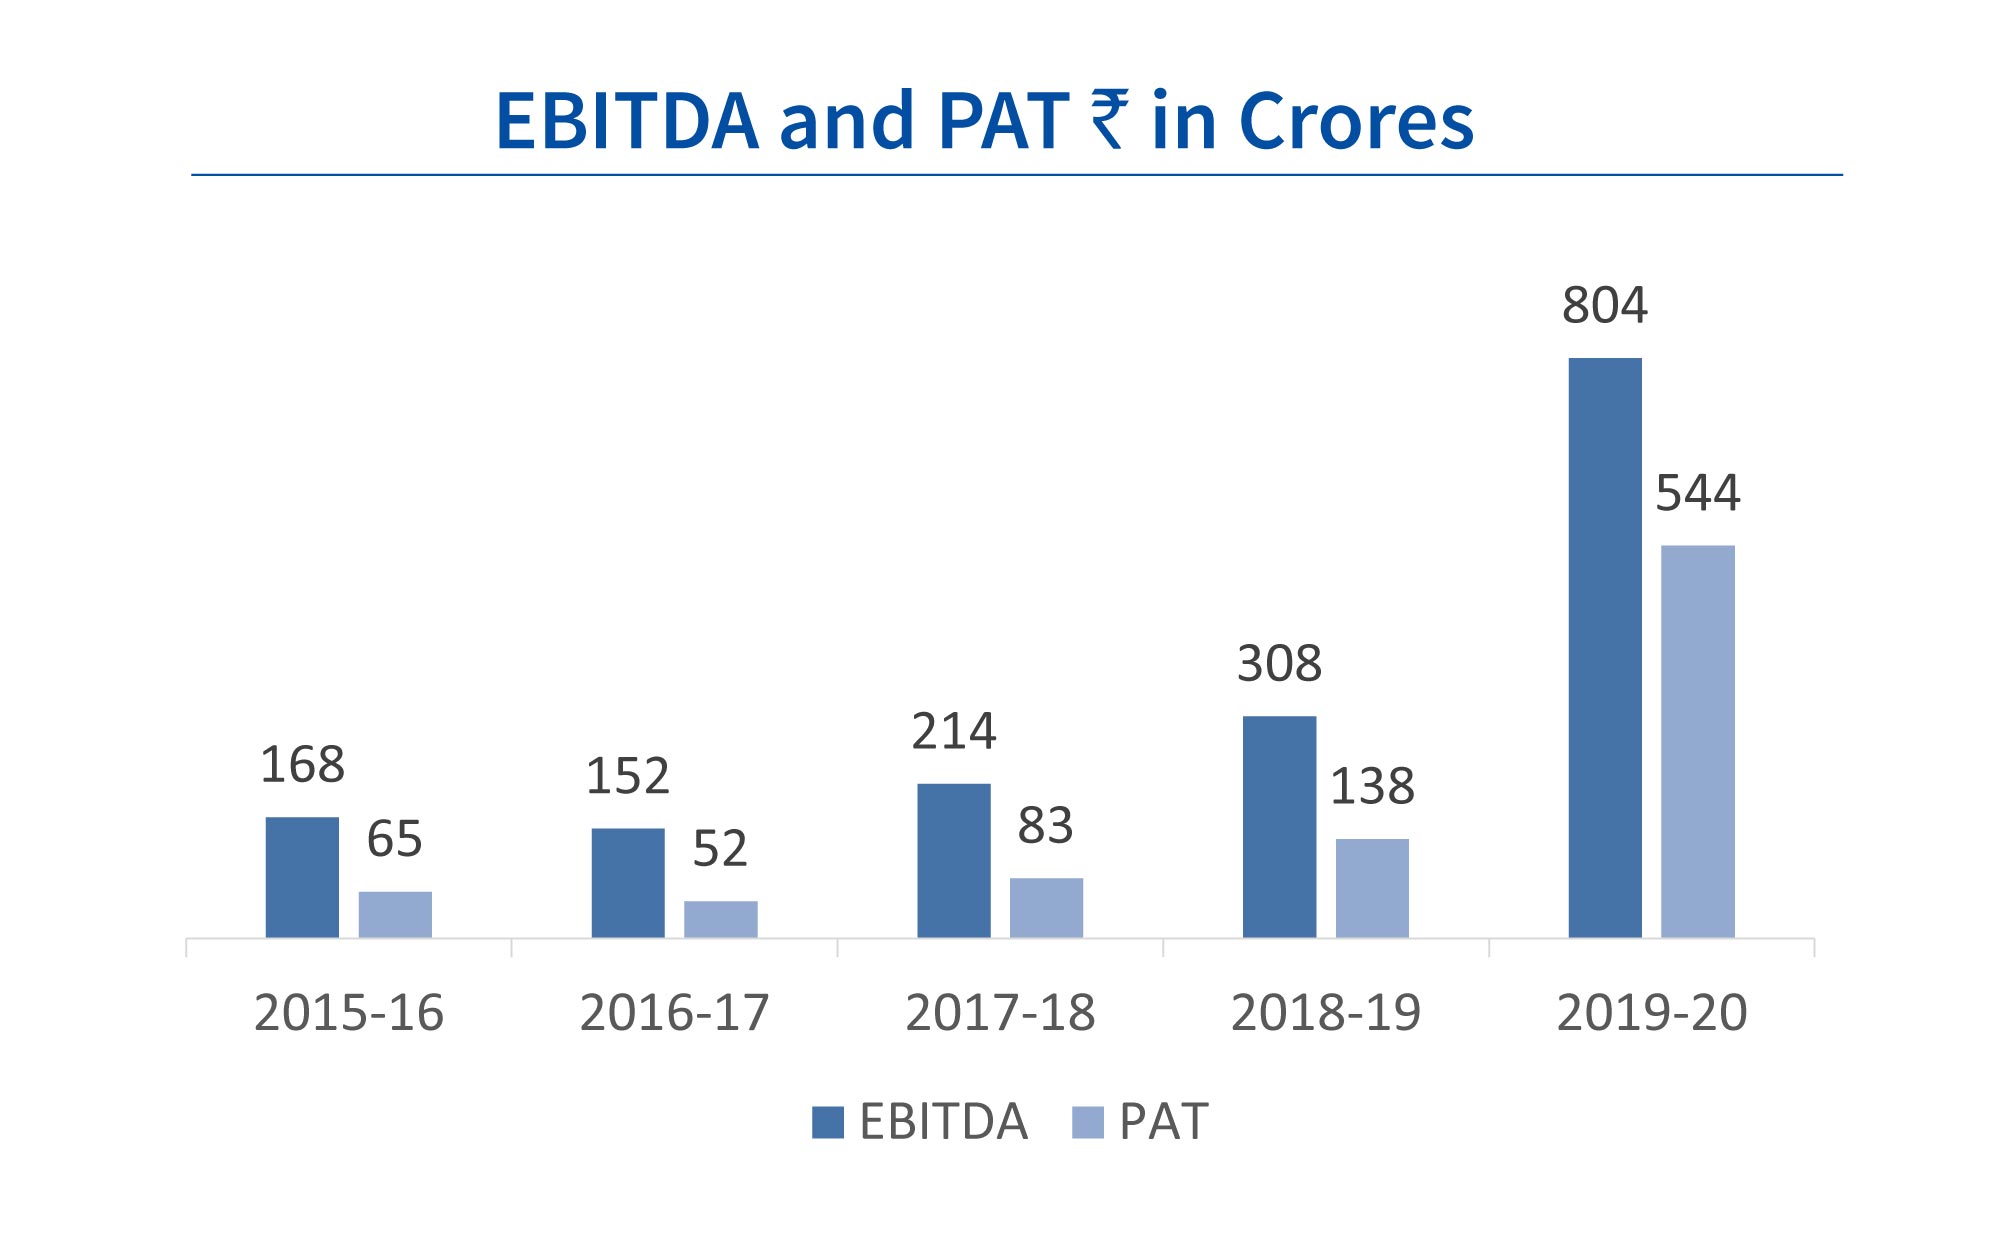
| 2 | EBITDA | ₹ in Cr | 1061 | 429 | 804 | 308 | 214 | 152# | 168 | 140 | 114 | 81 | 58 | 62 |
| 3 | Profit / ( Loss) Before Taxation | ₹ in Cr | 806 | 268 | 706 | 212 | 122 | 74# | 91 | 68 | 58 | 53 | 32 | 37 |
| Percentage to Total Income | % | 18.91 | 9.87 | 31.56 | 11.84 | 8.19 | 5.58 | 6.83 | 5.10 | 4.57 | 5.10 | 3.98 | 5.46 | |
| 4 | Profit / ( Loss) After Taxation | ₹ in Cr | 611 | 174 | 544 | 138 | 83 | 52# | 65 | 53 | 38 | 38 | 23 | 26 |
| Percentage to Total Income | % | 14.33 | 6.40 | 24.32 | 7.69 | 5.60 | 3.92 | 4.87 | 4.02 | 3.01 | 3.67 | 2.91 | 3.81 | |
| 5 | Equity | ₹ in Cr | 27 | 27 | 27 | 27 | 27 | 26 | 23 | 21 | 10 | 10 | 10 | 10 |
| 6 | Net worth | ₹ in Cr | 1572 | 1072 | 1491 | 1058 | 944 | 732 | 476 | 347 | 308 | 281 | 253 | 238 |
| 7 | Debt | ₹ in Cr | 1099 | 1187 | 208 | 328 | 462 | 574 | 495 | 545 | 505 | 335 | 171 | 60 |
| 8 | Dividend on Equity Capital | ₹ in Cr | 61** | 27## | 61** | 27## | 18 | 16 | 14 | 10 | 10 | 8 | 6 | 6 |
| Percentage | % | 225** | 100## | 225** | 100## | 65 | 60 | 60 | 50 | 100 | 80 | 60 | 60 | |
| 9 | EPS | ₹ | 44.80 | 12.73 | 39.89 | 10.12 | 6.34 | 4.43 | 6.07 | 5.11 | 36.63 | 36.15 | 22.06 | 24.65 |
| 10 | Book Value | ₹ | 115 | 79 | 109 | 78 | 72 | 62 | 44 | 34 | 294 | 268 | 242 | 235 |
| 11 | Net Debt/ Equity Ratio | % | 69.93 | 110.73 | 13.92 | 30.97 | 48.90 | 78.34 | 104.06 | 157.00 | 164.23 | 119.55 | 67.63 | 25.04 |
|
* Units of Measurement |


